Nevada’s Equity/Growth All-Star Schools
Growth and proficiency are the two crucial dimensions by which most American education systems, and the performance of the students they serve, are currently measured.
Nevada’s education trajectory today is best characterized in terms of growth, as most any Nevada educator will attest. “Fastest Improving State in the Nation,” has been a recurring catchphrase of Nevada’s Department of Education, and was the title of its 2019 annual report to the governor and legislature.
Consequently, students’ academic growth over time is one of the central components to Nevada’s Five-Star system for evaluating its public elementary and middle schools. The rate of students at grade-level proficiency is the other central component.
2018-19 Top Math Growth/High FRL Elementary Schools
| Ref | School | DISTRICT | Math - School MGP | FRL % |
|---|---|---|---|---|
| 1 | Mater MT Vista ES | SPCSA | 82 | 91% |
| 2 | Dondero ES | Clark | 78 | 82% |
| 3 | Sandy Valley ES | Clark | 77 | 94% |
| 4 | NV Prep ES | Achievement | 76 | 90% |
| 5 | Diaz ES | Clark | 75 | 100% |
| 6 | Meneley ES | Douglas | 75 | 57% |
| 7 | Hawthorne ES | Mineral | 75 | 51% |
| 8 | Caliente ES | Lincoln | 74 | 55% |
| 9 | Mater North NV ES | SPCSA | 73 | 81% |
| 10 | Maxwell ES | Washoe | 72 | 84% |
The number of Nevada’s highest-growth public schools serving lower-income student populations provides a powerful indication that our quest to be America’s fastest-improving education state is on sound footing. Many educators feel that student growth is the preferred indicator of a particular school’s performance, better and fairer because students arrive with their own, different learning trajectories and levels of preparedness, the result of numerous factors including schools attended previously. This often holds especially true when evaluating schools serving students from lower-income households, who often have higher mobility rates than their peers.
More than three out of five students in Nevada public schools are eligible for free or reduced-price meals under the National School Lunch program (different measures by different government agencies calculate slightly different rates). In fact, Nevada’s education laws define this eligibility, by measure of household income, as what determines whether students are considered to be “At-Risk.” A student can be eligible for reduced-price meals if their family income is at 185 percent of federal poverty guidelines.
2018-19 Top ELA Growth/High FRL Elementary Schools
| Ref. | School | District | ELA - School MGP | FRL % |
|---|---|---|---|---|
| 1 | Cambeiro ES | Clark | 82 | 100% |
| 2 | Maxwell ES | Washoe | 75 | 84% |
| 3 | Diaz ES | Clark | 75 | 100% |
| 4 | Gehring ACAD ES | Clark | 74 | 50% |
| 5 | Corbett ES | Washoe | 70 | 91% |
| 6 | Smith Helen ES | Clark | 69.5 | 68% |
| 7 | Bryan Richard ES | Clark | 68.5 | 55% |
| 8 | Hillside ES | Storey | 68 | 59% |
| 9 | Mater North NV ES | SPCSA | 68 | 81% |
| 10 | Ronzone ES | Clark | 68 | 98% |
Which Nevada public schools have the highest rates of student growth while also serving student populations of whom fifty percent meet this definition? These schools comprise Nevada’s Equity/Growth All-Stars – elementary and middle schools with the highest scores for student growth in English Language Arts (ELA) and math for the 2018-19 school year.
These All-Star schools are located all across the state – in eight of Nevada’s 18 school districts, including seven charter schools under the supervision of the State Public Charter School Authority. The list includes rural, urban and schools in-between, and five serving more than 95 percent designated low-income students.
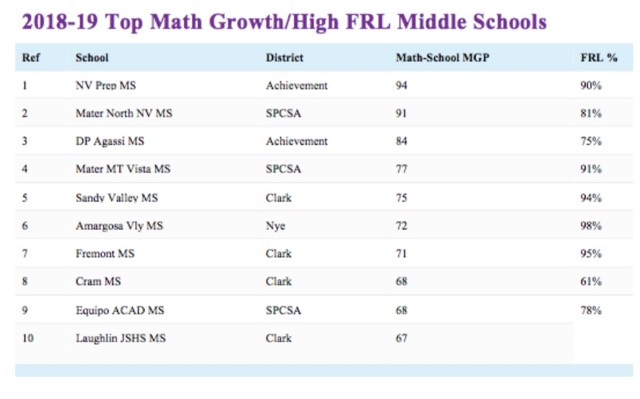
2018-19 Top Math Growth/High FRL Middle Schools
| Ref | School | District | Math-School MGP | FRL % |
|---|---|---|---|---|
| 1 | NV Prep MS | Achievement | 94 | 90% |
| 2 | Mater North NV MS | SPCSA | 91 | 81% |
| 3 | DP Agassi MS | Achievement | 84 | 75% |
| 4 | Mater MT Vista MS | SPCSA | 77 | 91% |
| 5 | Sandy Valley MS | Clark | 75 | 94% |
| 6 | Amargosa Vly MS | Nye | 72 | 98% |
| 7 | Fremont MS | Clark | 71 | 95% |
| 8 | Cram MS | Clark | 68 | 61% |
| 9 | Equipo ACAD MS | SPCSA | 68 | 78% |
| 10 | Laughlin JSHS MS | Clark | 67 | 70 |
The Clark County School District is home to 13 of the All-Stars on this list. One of these, John C. Fremont Middle School, appears on the list of top growth schools in both ELA and Math, located in a zip code in the heart of the city, with an average household income well below the average for Las Vegas. The other CCSD school appearing on both top lists, Ruben P. Diaz Elementary School, is in the neighborhood around Nellis Air Force Base, where household income resides just above the $53,000 Las Vegas average. A charter school authorized by CCSD, 100 Academy of Excellence in North Las Vegas, made the list of top middle schools for growth in math.
Nevada Prep public charter school in Las Vegas was the top middle school in the state for student growth in both math and English Language Arts, while serving a student population with nine out of ten students eligible for Free or Reduced Lunch. “We focus a lot on culture. People won’t work this hard unless they’re doing it for a shared mission and for peers and students they value,” observes David Blodgett’s founder and executive director David Blodgett.
Mater Academy of Northern Nevada earned grand slam All-Star status with student growth performance placing it in the top ten of all public schools in the state on all four lists. “We believe that every student who walks through the doors of Mater Academy of Northern Nevada deserves respect and support, no matter what their situation is or was,” explains principal Gia Maraccini. “We strive to build real relationships with our students. We provide them with a strong support system so that when life’s challenges come along, we work together as a school community to overcome them.” All three Nevada Mater Academy public charter schools appeared on the list of Nevada’s Equity/Growth All-Stars.
Students’ academic growth means the amount of academic progress they have made over time. In Nevada, as in most states, this is measured annually based on how each individual learner performs on the statewide standardized test (the Smarter Balanced Assessment, or SBAC) currently, from how they performed the previous year, compared with their peers. Schools are evaluated on growth as a percentile level, more precisely described as a Median Growth Percentile, or MGP, based upon all of their students’ performance. A student with an MGP of 60 has growth exceeding 60 percent of their peers, for example.
2018-19 Top ELA Growth/High FRL Middle Schools
| Ref. | School | District | ELA-School MGP | FRL % |
|---|---|---|---|---|
| 1 | NV Prep MS | Achievement | 81 | 90% |
| 2 | Mater North NV MS | SPCSA | 81 | 81% |
| 3 | Mater MT Vista MS | SPCSA | 80 | 91% |
| 4 | DP Agassi MS | Achievement | 68.5 | 75% |
| 5 | Fremont MS | Clark | 67 | 95% |
| 6 | Mater Bonanza MS | SPCSA | 67 | 89% |
| 7 | 100 Academy 6-8 MS | Clark | 66 | 100% |
| 8 | Equipo ACAD MS | SPCSA | 65 | 78% |
| 9 | Quest Northwest MS | SPCSA | 64 | 69% |
| 10 | Laughlin JSHS MS | Clark | 63 | 70% |
Nevada’s official School Performance Framework measures the performance of elementary and middle schools based on two different growth measures – the MGP, as well as an application of both growth and proficiency, called the AGP, or “Adequate Growth Percentile.” The AGP is a calculation for each student based on how far away they are from grade-level proficiency, and how much growth is required to reach that level in five years or by the end of 12th grade.
Because MGP relies on growth only, and not proficiency, it can be considered less reliant on factors researchers could deem “background noise” reflective of other factors besides the effectiveness of the school a student currently attends.
What insights can these Equity/Growth All-Star Schools offer educators looking to improve their own student growth? While this topic is worthy of building a deeper understanding, a number of prominent practices stand out. School culture focused around academic growth seems a prevalent priority, as are certain other practices.
“We have an extra math period and an extra ELA period every day,” explains Nevada Prep’s David Blodgett. “We call these classes power hour, and we have multiple teachers in the room providing support and interventions at students’ different levels.”
Schools’ support for classroom teachers through help providing timely, actionable information on student progress to help them target interventions and extra help is another priority at many of these high-growth campuses. Regular meetings with teachers and coaches to discuss pedagogical strategies and specific lessons to build on strength and weaknesses, and meet students “where they are” in their learning, often become pillars of the schools’ culture for teaching and learning.
Equitable access to high-quality schools for all learners, regardless of their economic or other circumstances, should be a fundamental goal for any system of education. The educators working in the schools on these lists, and the families fortunate enough to be served in their classrooms, can be proud that their schools are making important strides to achieving this equity in their school communities.
Congratulations to the hard-working educators working at the schools on this list, and the leaders who support them – you are making a difference.


 A growing community within education believes they just might.